import matplotlib.pyplot as plt
import numpy as npMatplotlib quick reference
This notebook includes several code snippets and examples of different features of Matplotlib. Matplotlib is a big library and there are many ways to use it. The more customized you want your plots to be, the more you will want to refer to the official Matplotlib documentation. But if you’re just looking to make basic plots with labeled axes, this guide may be enough for you.
Basic plotting
Line plot
x = np.linspace(-2,2)
y = x**3
plt.plot(x,y)  # <--- matplotlib.pyplot.plot() creates a line plot with two arrays of equal length
plt.xlabel("x axis")  # <--- add axis labels
plt.ylabel("y axis")
plt.title("A line plot of $y=x^3$")  # <--- and a title
plt.grid()  # <--- includes gridlines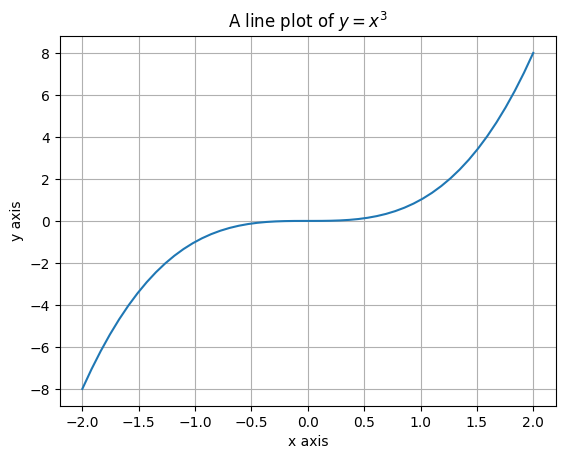
Scatter plot
x = np.linspace(-2, 2)
noise = np.random.rand(len(x))
y = (x) ** 3 + noise
plt.scatter(x, y)  # scatter() uses similar inputs as plot()
plt.xlabel("x axis")  # <--- add axis labels
plt.ylabel("y axis")
plt.title("A scatter plot of $y=x^3$ with random noise added")  # <--- and a title
plt.grid()  # <--- includes gridlines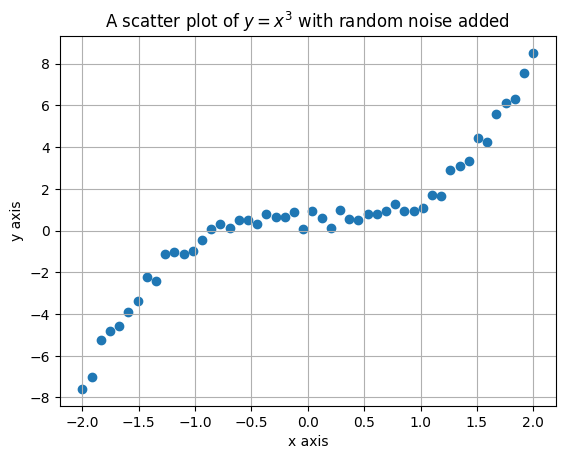
Styling and Customization
If you want specific line types, markers, or colors, those can be added as arguments to either the plt.plot() or plt.scatter() functions after the x and y inputs. You can also include labels for the data if more than one set of data is being shown. Use the plt.legend() function to display the legend on the plot.
Refer to these pages for the available options:
x = np.linspace(-2, 2)
y = x**3
plt.plot(x, y, "-r", label="A solid red line")
plt.plot(x, -y, "--g", label="A dashed green line")
plt.xlabel("x axis")
plt.ylabel("y axis")
plt.title("A line plot of $y=x^3$")
plt.legend() # <--- include a legend on the plot
plt.grid()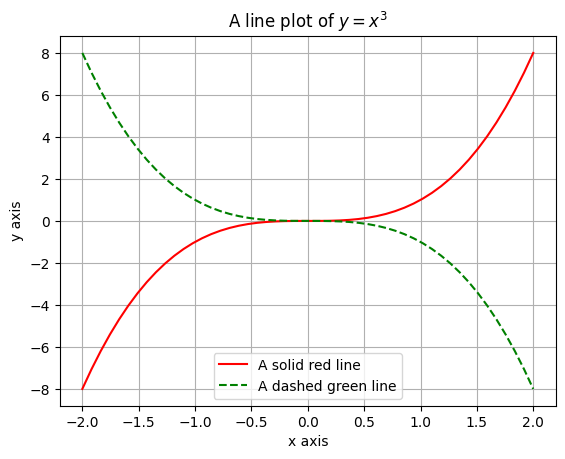
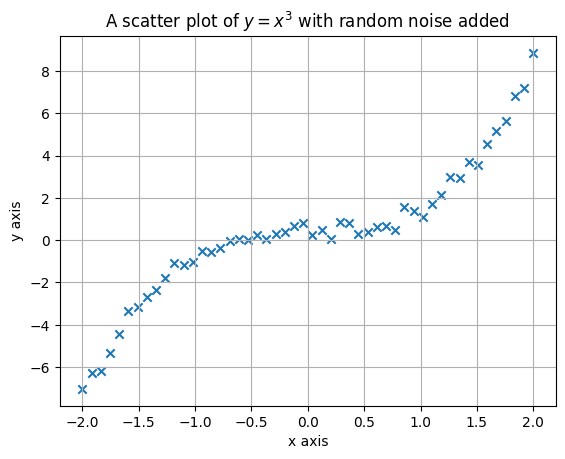
x = np.linspace(-2, 2)
noise = np.random.rand(len(x))
y = (x) ** 3 + noise
plt.scatter(x, y, marker="x")  # <--- use the "marker" keyword to change the marker type
plt.xlabel("x axis")
plt.ylabel("y axis")
plt.title("A scatter plot of $y=x^3$ with random noise added")
plt.grid()