import numpy as np
import matplotlib.pyplot as pltImporting PDA data
# Load the data from CSV files
blow = 2813  # 3701
pda_force = np.loadtxt(f"force_DD-21_blow_{blow}.csv", delimiter=",", skiprows=1)
pda_vel = np.loadtxt(f"vel_DD-21_blow_{blow}.csv", delimiter=",", skiprows=1)

# Extract time and data columns
time = pda_force[:, 0]
measured_force = pda_force[:, 1]
measured_vel = pda_vel[:, 1]
# DO NOT use this instead of the impedance factor, Z, in you project.
# This was just done in class to show an order of magnitude estimate for what
# Z should end up being.
Z_ish = max(measured_force)/max(measured_vel)
print(Z_ish)--------------------------------------------------------------------------- NameError Traceback (most recent call last) Cell In[1], line 4 1 # DO NOT use this instead of the impedance factor, Z, in you project. 2 # This was just done in class to show an order of magnitude estimate for what 3 # Z should end up being. ----> 4 Z_ish = max(measured_force)/max(measured_vel) 5 print(Z_ish) NameError: name 'measured_force' is not defined
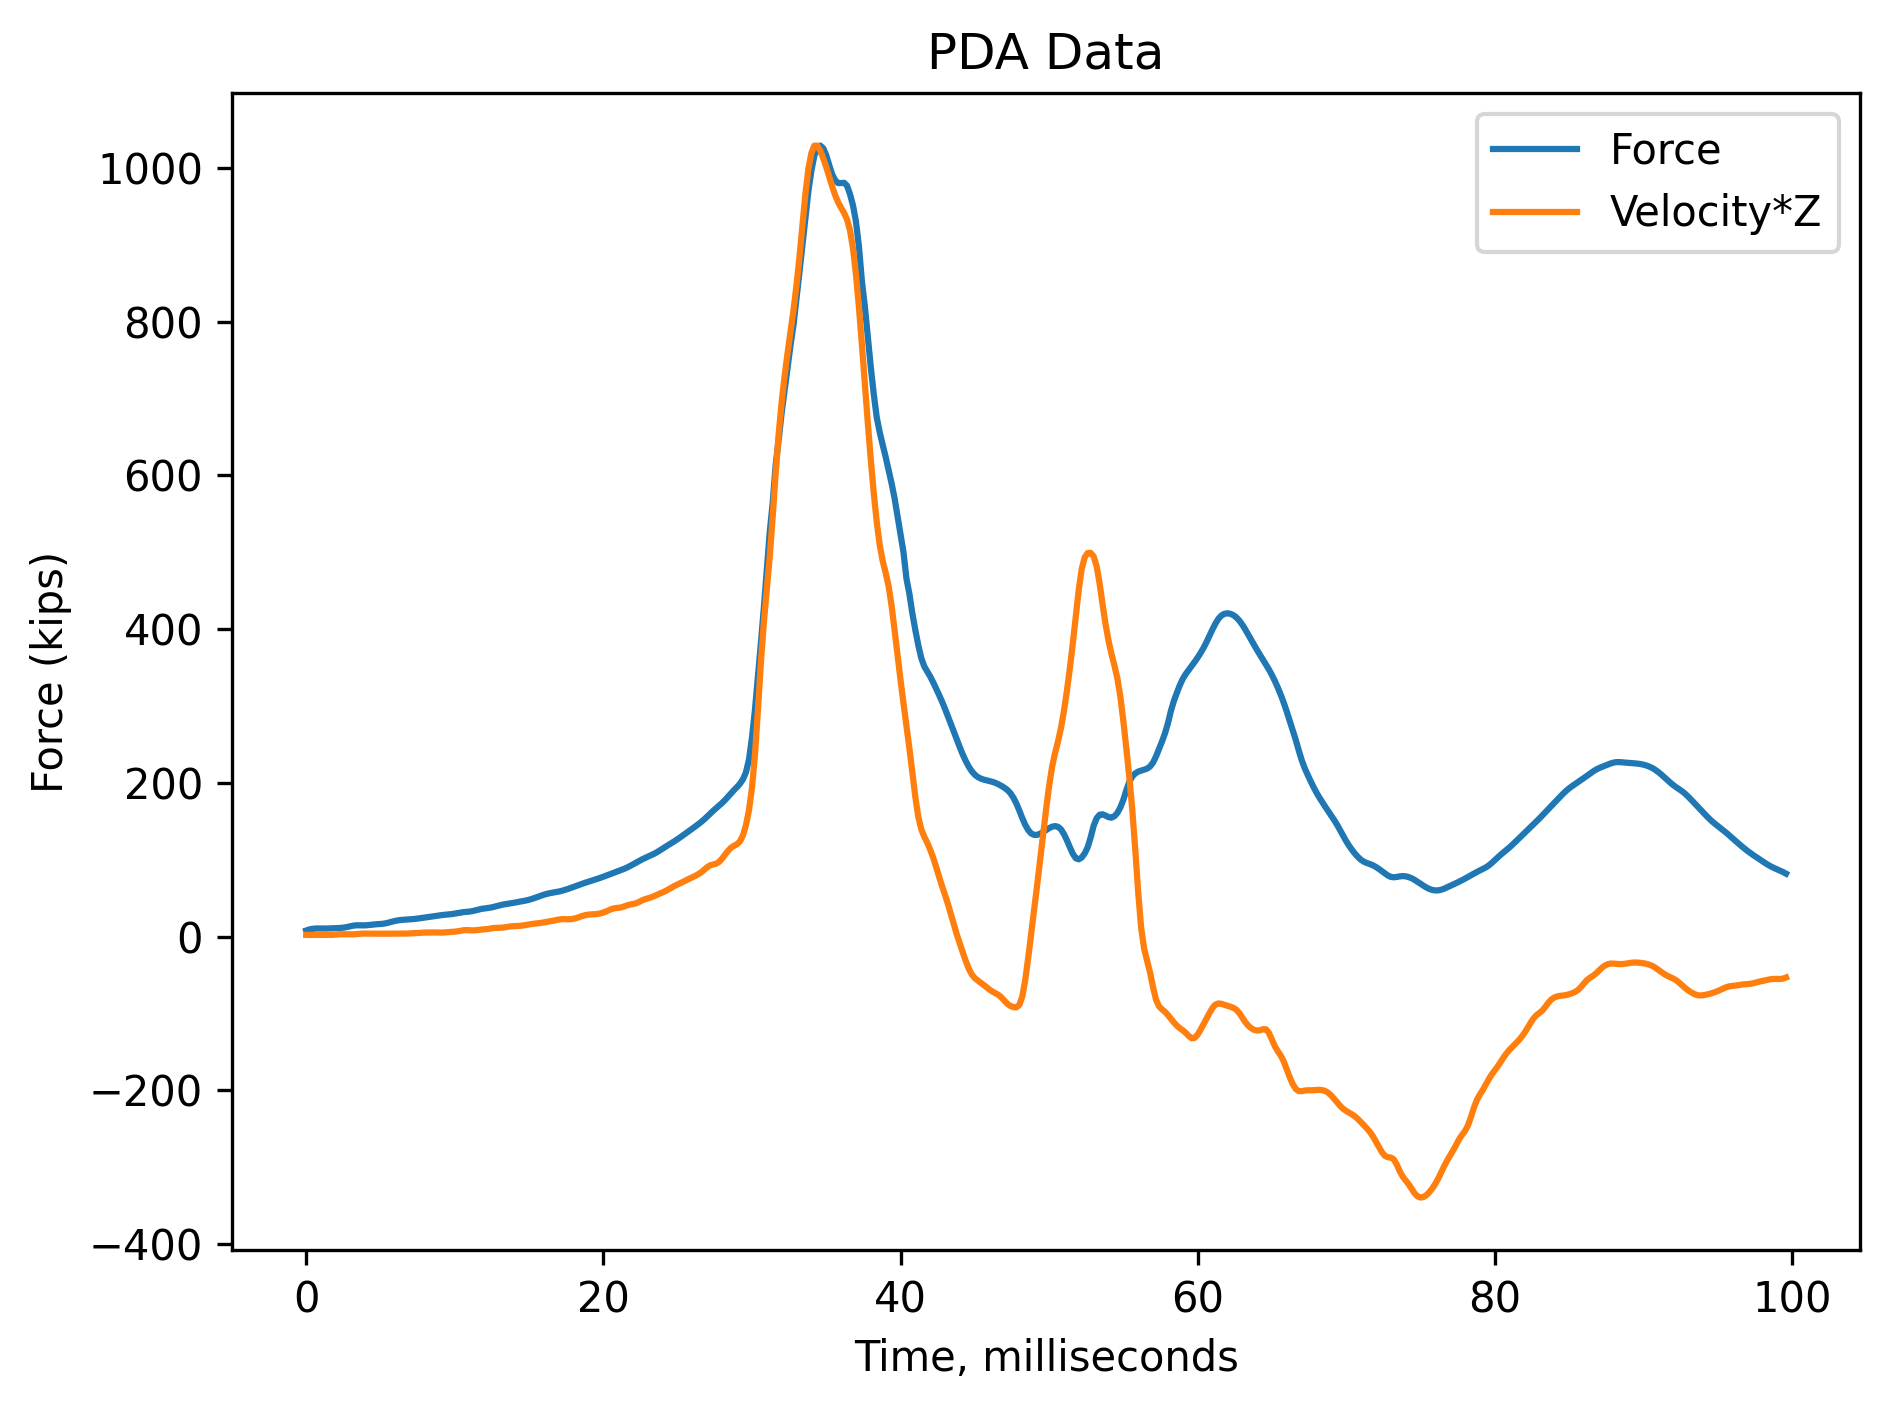
# Create plots
fig, ax = plt.subplots()

# Plot force
ax.plot(time, measured_force, label="Force")
ax.plot(time, measured_vel*Z_ish, label="Velocity*Z")

ax.set_ylabel("Force (kips)")
ax.set_title("PDA Data")
ax.set_xlabel("Time, milliseconds")
ax.legend()

plt.tight_layout()
plt.show()