import matplotlib.pyplot as plt
import numpy as npPlotting a sine wave
This notebook shows how to use matplotlib and numpy to plot a sine wave.
First, import the required packages:
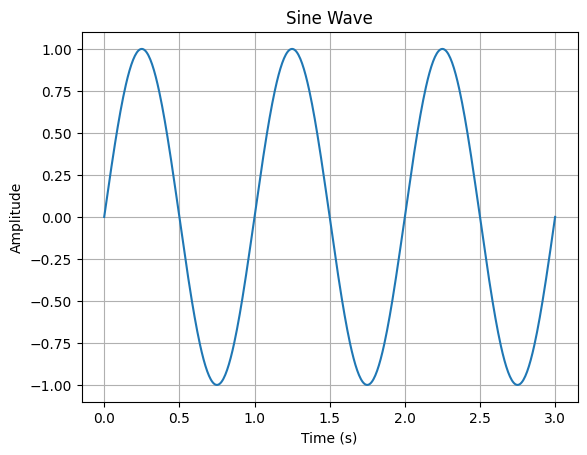
Then create a time array using Numpy’s linspace() and an amplitude array by using the newly created time array as input to Numpy’s sin(). I also include a factor of \(2 \pi\) radians so that one second corresponds to one full sine period.
time = np.linspace(0, 3, 500)
amplitude = np.sin(2 * np.pi * time)
Use plt.subplots() to create a figure and axes to plot on. Add the plot to the axes with the plot(x, y) method, providing time as the x variable and amplitude as the y variable.
fig, ax = plt.subplots()
ax.plot(time, amplitude)
ax.set(xlabel='Time (s)', ylabel='Amplitude', title='Sine Wave')
ax.grid()
plt.show()